
Table of Contents
ToggleBlood Pressure Calculator — Track Your Average BP with the SMBP Method
Knowing your true blood pressure means looking past a single office reading. The Blood Pressure Calculator lets you log multiple systolic and diastolic readings over several days and instantly returns your clinically-weighted average, pulse pressure, and mean arterial pressure (MAP) — using the Self-Measured Blood Pressure (SMBP) protocol endorsed by the American Heart Association (AHA) and American College of Cardiology (ACC). It’s built for anyone who wants a more reliable picture of their cardiovascular health than a single snapshot reading can offer: patients monitoring hypertension, people newly prescribed medication, and caregivers tracking a family member’s numbers at home.
Self-Measured Blood Pressure Calculator
Uses the SMBP protocol endorsed by the American Heart Association & American Medical Association. Enter your daily readings for a clinically accurate average & categorisation.
2 readings per sessionMorning & EveningMin. 3 daysOptimal: 7 days
▾
▾
Enter Your BP ReadingsEnter Systolic and Diastolic in mmHg (valid range: SYS 70–250, DIA 40–150)
Your Average Blood Pressure Result
--
SYS
mmHg
mmHg
/
--
DIA
mmHg
mmHg
--Readings Used
--Days Monitored
--Highest SYS
--Lowest SYS
--Highest DIA
--Lowest DIA
BP Classification Reference
Based on 2017 AHA/ACC Guidelines • Home BP hypertension threshold: ≥135/85 mmHg
| Category | Systolic (mmHg) | | Diastolic (mmHg) |
|---|
Disclaimer: This tool is for informational purposes only and does not constitute medical advice or a clinical diagnosis. Always consult a qualified healthcare professional for evaluation and treatment.
⚠
Reset All Data?All entered readings, results, and saved session data will be permanently cleared. This cannot be undone.
✓
How the Blood Pressure Calculator Works
This calculator applies the SMBP averaging method rather than relying on one isolated number. Home blood pressure monitoring is inherently variable — stress, posture, caffeine, and even the time of day can shift a single reading by 10 mmHg or more. The AHA and ACC recommend averaging multiple readings, taken over multiple days, to smooth out this natural variability and produce a number that better reflects your actual baseline.
The tool asks for two inputs per session — a systolic number (the pressure when your heart beats) and a diastolic number (the pressure between beats) — captured in millimeters of mercury (mmHg). You record two readings each morning and two each evening (the standard SMBP cadence), for a minimum of 3 days and an optimal window of 7 days. Many protocols recommend discarding Day 1 entirely, since first-day readings tend to run higher due to unfamiliarity with the cuff and situational anxiety — which is why an “Exclude Day 1” option is built in.
Once your readings are entered, the calculator computes:
- Average Systolic and Diastolic Blood Pressure — the mean of all valid readings across the monitoring period
- Pulse Pressure — the difference between your systolic and diastolic average (Systolic − Diastolic), a useful secondary indicator of arterial stiffness
- Mean Arterial Pressure (MAP) — calculated as Diastolic + ⅓(Systolic − Diastolic), representing the average pressure in your arteries across a full cardiac cycle
- Category Classification — your averaged reading is placed into a standard blood pressure category (see below)
The formula logic stays transparent throughout — nothing here is a black box. Every number the calculator returns can be traced back to the readings you entered and the standard formula used to derive it.
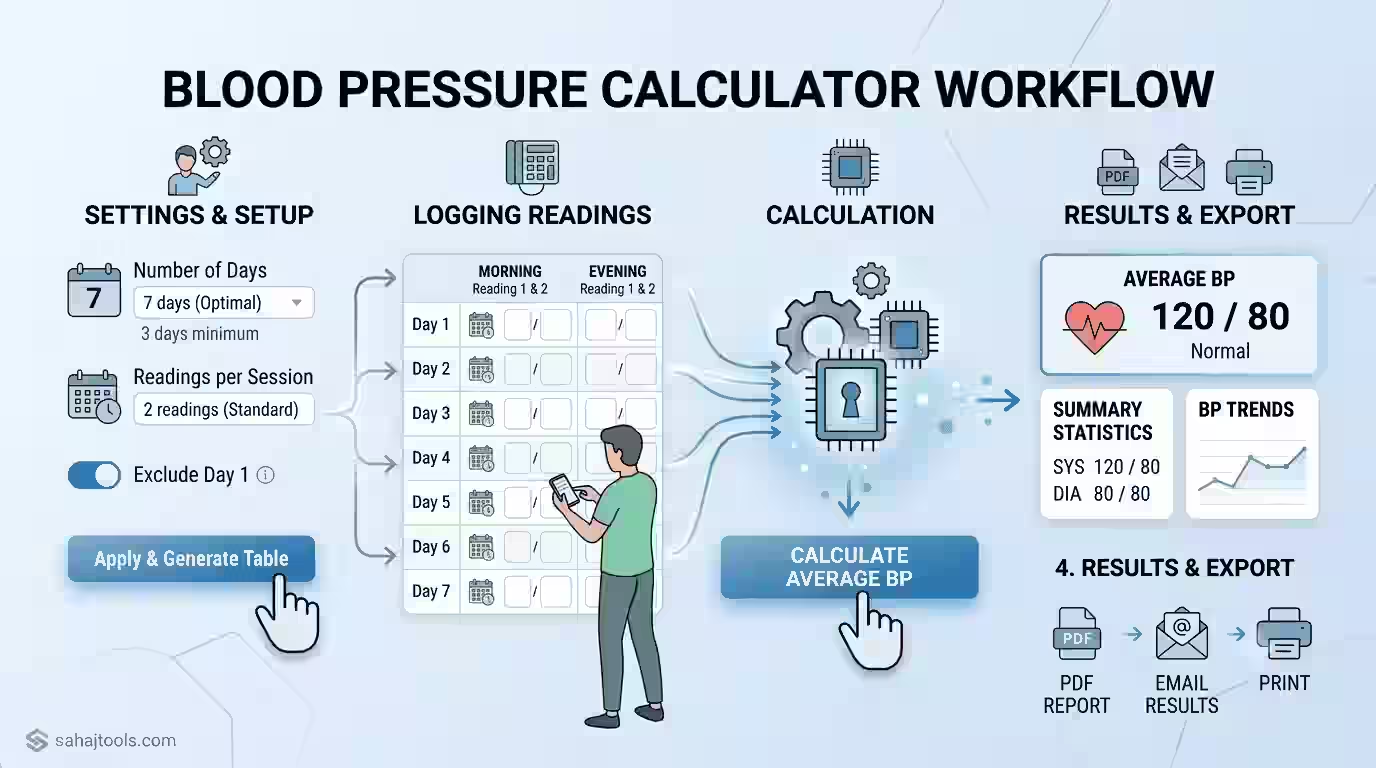
Step-by-Step: Using the Calculator
- Choose your monitoring settings. Select the number of days (minimum 3, optimal 7) and readings per session (standard is 2 readings, morning and evening).
- Decide whether to exclude Day 1. If you want a more representative average, tick “Exclude Day 1” to remove first-day readings, which are often elevated due to measurement anxiety.
- Click “Apply & Generate Table” to build your personalized entry grid.
- Enter each systolic/diastolic pair for every morning and evening session, in mmHg. The tool validates entries within a physiologically plausible range (systolic 70–250, diastolic 40–150) to catch obvious data-entry errors.
- Click “Calculate Average BP” to generate your average systolic and diastolic blood pressure, pulse pressure, MAP, and category classification.
Worked Examples
Example 1 — Normal range:
A user logs 7 days of readings (2 per session, morning and evening) with Day 1 excluded. Their averaged results come out to 118/76 mmHg.
- Pulse pressure: 118 − 76 = 42 mmHg
- MAP: 76 + ⅓(118 − 76) = 76 + 14 = 90 mmHg
- Category: Normal
Example 2 — Elevated/Stage 1 range:
A different user, monitoring after a recent diagnosis, logs readings across 7 days that average to 134/85 mmHg.
- Pulse pressure: 134 − 85 = 49 mmHg
- MAP: 85 + ⅓(134 − 85) = 85 + 16.3 = 101.3 mmHg
- Category: Stage 1 Hypertension (per ACC/AHA thresholds)
These examples illustrate how the same calculation method applies whether numbers land comfortably in the normal range or edge into hypertensive territory — the formula doesn’t change, only the interpretation of the result does.
Interpreting Your Blood Pressure Categories
Averaged blood pressure readings are generally interpreted against the ACC/AHA blood pressure categories, which classify adult blood pressure as follows:
- Normal: Below 120/80 mmHg
- Elevated: Systolic 120–129 and diastolic below 80 mmHg
- Stage 1 Hypertension: Systolic 130–139 or diastolic 80–89 mmHg
- Stage 2 Hypertension: Systolic 140 or higher, or diastolic 90 or higher
- Hypertensive Crisis: Systolic over 180 and/or diastolic over 120 mmHg — this requires immediate medical attention, not just a follow-up appointment
Note that these specific numeric thresholds are the ACC/AHA guideline framework as commonly published; guidelines are periodically revised, and regional bodies such as the European Society of Hypertension (ESH) and European Society of Cardiology (ESC) use categories that differ slightly. Always confirm the current thresholds with your clinician or the source guideline rather than treating any single number as fixed indefinitely.
Pulse pressure and MAP add useful context beyond the systolic/diastolic pair alone. A widening pulse pressure over time can reflect changes in arterial stiffness, while MAP is often used clinically to assess organ perfusion — both are supplementary data points, not stand-alone diagnostic values.
Who Should Use This Calculator
- Patients recently diagnosed with hypertension who need to track how lifestyle changes or medication are affecting their numbers over time
- People with a family history of high blood pressure who want a baseline before symptoms appear
- Caregivers monitoring an elderly parent or family member’s home readings between clinical visits
- Anyone preparing for a doctor’s appointment who wants to bring a clean, averaged data set rather than a single reading taken that morning
- Individuals recovering from a cardiovascular event who have been asked by their care team to log home readings for review
Factors That Affect Your Blood Pressure Reading
Several variables can shift an individual reading independent of your underlying blood pressure, which is exactly why averaging over multiple days matters:
- Cuff size and position — an improperly sized cuff or an arm held below heart level can distort readings by several mmHg
- Time of day — blood pressure naturally follows a circadian rhythm, typically lower overnight and rising toward morning
- Caffeine, nicotine, and recent exercise — each can transiently elevate readings if measured shortly afterward
- Talking or moving during measurement — activity during the reading is one of the most common sources of inflated results
- White coat effect — office readings are often higher than home readings due to situational anxiety, which is part of why home blood pressure monitoring is now widely recommended alongside or instead of relying solely on clinical visits
- Measurement device calibration — an uncalibrated or low-quality home monitor can introduce systematic error across every session
How Often Should You Check Your Blood Pressure?
For general home monitoring, checking blood pressure once or twice daily over a 7-day period (following the SMBP protocol) provides a reliable snapshot. If you’ve been diagnosed with hypertension or started a new medication, your clinician may recommend more frequent monitoring during the adjustment period, then tapering to periodic spot-checks once your numbers stabilize. Paediatric normal vitals differ from adult thresholds by age and height percentile, so parents tracking a child’s blood pressure should reference paediatric-specific charts rather than the adult categories above.
Frequently Asked Questions
Systolic pressure (the top number) measures the force in your arteries when your heart contracts and pushes blood out. Diastolic pressure (the bottom number) measures the force when your heart relaxes between beats. Both are recorded in mmHg and together form your blood pressure reading.
Your category depends on your averaged systolic and diastolic numbers compared against the ACC/AHA thresholds: normal is below 120/80 mmHg, elevated is 120–129 systolic with diastolic under 80, and Stage 1 or Stage 2 hypertension begins at 130/80 mmHg and 140/90 mmHg respectively. This calculator classifies your averaged result automatically, but a single reading should always be confirmed with a healthcare provider before drawing conclusions.
Pulse pressure is simply your systolic reading minus your diastolic reading. Mean arterial pressure (MAP) is calculated as diastolic pressure plus one-third of your pulse pressure — this calculator computes both automatically from your averaged readings.
The SMBP protocol recommends a minimum of 3 days of monitoring, with 7 days considered optimal, taking 2 readings each morning and evening. Many clinicians also recommend excluding Day 1 readings, since first-day numbers tend to run higher due to unfamiliarity with the process.
Sit quietly for five minutes beforehand, keep your back supported and feet flat on the floor, rest your arm at heart level, and avoid talking, caffeine, or exercise in the 30 minutes prior. Take two readings roughly a minute apart and record both — this reduces the impact of any single anomalous reading on your average.
A hypertensive crisis is generally defined as a systolic reading above 180 mmHg and/or a diastolic reading above 120 mmHg. This is a medical emergency requiring immediate attention, not a result to simply log and monitor — if you see numbers in this range, seek urgent medical care rather than waiting for your next scheduled reading.
The ACC/AHA framework classifies blood pressure into Normal (under 120/80), Elevated (120–129/under 80), Stage 1 Hypertension (130–139/80–89), Stage 2 Hypertension (140+/90+), and Hypertensive Crisis (180+/120+). These thresholds are periodically reviewed, so it's worth confirming the current version with your care provider or the guideline source directly.
For routine home monitoring, once or twice daily over a 7-day stretch gives a reliable average. If you have diagnosed hypertension or a recent medication change, follow your clinician's specific monitoring schedule, which may call for more frequent checks during the adjustment period.
Important Medical Disclaimer
This calculator is intended for informational and self-monitoring purposes only and is not a substitute for professional clinical judgment. It does not diagnose hypertension, hypotension, or any cardiovascular condition. Blood pressure categories and thresholds referenced here follow commonly published ACC/AHA guidance, but clinical guidelines are updated periodically — always verify current thresholds and interpret your results with a licensed healthcare provider. If you observe a reading in the hypertensive crisis range (180+/120+ mmHg), seek immediate medical attention rather than relying on this tool.
Sources & Further Reading
Blood pressure category thresholds and the SMBP averaging protocol referenced in this tool follow guidance published by the American Heart Association (AHA) and American College of Cardiology (ACC). Readers outside the US should also cross-reference guidance from the European Society of Hypertension (ESH) and European Society of Cardiology (ESC), as classification bands can differ by region. Always confirm current figures against the original guideline body rather than a secondary source.
Last Update: July 2026