
Table of Contents
ToggleEBITDA Calculator: Measure Core Business Profitability
An EBITDA Calculator computes Earnings Before Interest, Taxes, Depreciation, and Amortization — a measure of a company’s core operating profitability independent of its financing structure and non-cash accounting charges. Enter your net income plus the four add-backs (interest, taxes, depreciation, amortization) and the tool returns your EBITDA figure and EBITDA margin in seconds.
Financial Tool
EBITDA CalculatorEarnings Before Interest, Taxes, Depreciation & Amortization — Measure your core operational profitability with precision.
Formula:EBITDA = Net Income + Interest + Taxes + Depreciation + Amortization
$
$
$
$
$
$
$
$
$
$
EBITDA
$0
📉
EBITDA Margin
—
EBITDA ÷ Revenue
💡
DA Add-back
$0
Depreciation + Amortization
📊
EBIT
$0
Operating Profit
Calculation BreakdownNet Income Method
= EBITDA$0
📐 Industry Benchmark Guide
EBITDA margin benchmarks vary by sector. Compare your result to these typical ranges:
Technology / SaaS20–40%
Healthcare15–25%
Retail / E-Commerce5–15%
Manufacturing10–20%
Financial Services25–45%
Hospitality / F&B8–18%
⚠️
Reset Calculator?All inputs and results will be cleared. This cannot be undone.
related finance & business calculators
What Is EBITDA?
EBITDA stands for Earnings Before Interest, Taxes, Depreciation, and Amortization. It represents the operating profit a business generates before the effects of its financing decisions (interest), tax jurisdiction (income taxes), and non-cash accounting charges (depreciation and amortization) are deducted.
The metric gained prominence during the 1980s leveraged buyout era, when private equity firms needed a fast, capital-structure-neutral gauge of a company’s debt-service capacity. Today it is used by business owners assessing operational health, financial analysts building valuation models, M&A advisors benchmarking acquisition targets, and commercial bankers setting covenant thresholds in credit agreements.
A critical point: EBITDA is not a GAAP (Generally Accepted Accounting Principles) measure. The Financial Accounting Standards Board (FASB) does not define it, and the U.S. Securities and Exchange Commission (SEC) classifies it as a non-GAAP financial measure. Any public company reporting EBITDA is required by SEC Regulation G to reconcile it to the nearest GAAP metric — typically net income or operating income — in the same document or presentation.
The EBITDA Formula and Two Calculation Methods
There are two mathematically equivalent approaches to computing EBITDA from a standard income statement.
Method 1 — Net Income Method (Bottom-Up)
EBITDA = Net Income + Interest Expense + Income Taxes + Depreciation + Amortization
Begin at the bottom of the income statement — net income — and add back each of the four items that were previously deducted to reach it. This method is most common in financial modeling because all five line items appear on or near the income statement.
Method 2 — Operating Profit Method (Top-Down)
EBITDA = Operating Income (EBIT) + Depreciation + Amortization
Operating income (also called EBIT — Earnings Before Interest and Taxes) already excludes interest and tax expense. You need only add back depreciation and amortization to reach EBITDA. This method is faster when operating income appears as a labeled subtotal on the income statement.
Both methods produce the same result when applied to figures from the same reporting period.
Note on EBITA: EBITA — Earnings Before Interest, Taxes, and Amortization — is a less common variant that adds back amortization but retains depreciation. It is sometimes used for asset-heavy businesses where annual equipment depreciation is considered a genuine, recurring economic cost rather than a mere accounting charge.
Why Depreciation and Amortization Are Added Back
Depreciation allocates the cost of tangible assets (machinery, buildings, vehicles) over their useful lives under ASC 360. Amortization allocates the cost of intangible assets (patents, trademarks, customer lists acquired in M&A transactions) over their useful lives under ASC 350. Neither represents a cash payment in the period it is recorded — both are non-cash charges. Removing them from the profit figure yields a result that more closely approximates the cash a business’s operations produce each period, independent of historical acquisition decisions.
Depreciation vs. amortization in practice: A manufacturer replacing printing equipment records depreciation; a technology company amortizing a purchased software patent records amortization. Both adjustments are added back identically in the EBITDA calculation.
Step-by-Step Guide: Using the EBITDA Calculator
The calculator supports both the Net Income Method and the Operating Profit Method via the two tabs at the top. Follow these steps:
- Choose your method. Click “Net Income Method” or “Operating Profit Method.” The input fields update to match the selected approach.
- Enter Net Income (Net Income Method only). Input the bottom-line net profit from your income statement after all expenses, interest, and taxes. Example: $500,000.
- Enter Interest Expense. Input total interest paid or accrued on loans, bonds, or lines of credit during the period. Example: $50,000.
- Enter Income Taxes. Input the total income tax expense recognized during the period — not the cash taxes paid, but the expense shown on the income statement. Example: $120,000.
- Enter Depreciation. Input the total depreciation expense for tangible assets during the period. Example: $80,000.
- Enter Amortization. Input total amortization of intangible assets for the period. Example: $30,000.
- Enter Total Revenue (optional — for margin). If you want the calculator to compute your EBITDA margin as a percentage, enter total revenue for the same period. Example: $2,000,000.
- Click “Calculate EBITDA →.” The result displays immediately — EBITDA in dollar terms, and EBITDA margin as a percentage if revenue was provided.
Ensure all figures cover the same reporting period — whether a full fiscal year, trailing twelve months (LTM), or a single quarter. Mixing periods produces meaningless output.
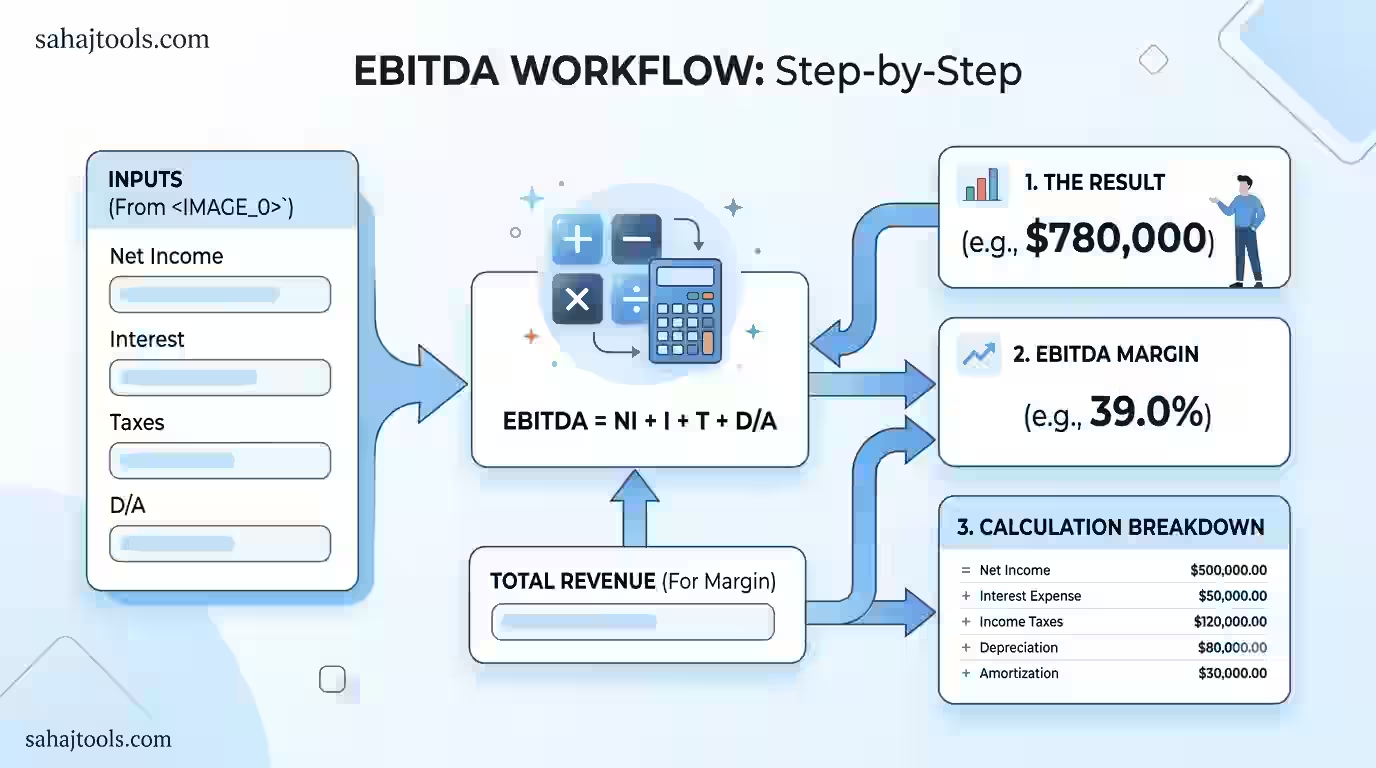
Worked Example 1 — Net Income Method
Scenario: A mid-sized manufacturing company is preparing for a potential sale and needs to present EBITDA to a prospective buyer’s due diligence team.
Income Statement Extract (Fiscal Year 2024):
Line Item | Amount |
Total Revenue | $2,000,000 |
Net Income | $500,000 |
Interest Expense | $50,000 |
Income Taxes | $120,000 |
Depreciation | $80,000 |
Amortization | $30,000 |
EBITDA Calculation:
$500,000 + $50,000 + $120,000 + $80,000 + $30,000 = $780,000
EBITDA Margin:
$780,000 ÷ $2,000,000 × 100 = 39.0%
Interpretation: The company generates $0.39 in EBITDA for every dollar of revenue. U.S. manufacturing businesses typically post EBITDA margins between 10% and 15%, so a 39% reading warrants further investigation — likely reflecting low leverage, high non-cash asset charges from recent equipment investment, or a mix of both. A buyer would examine the individual add-back items closely before attributing the elevated margin to pure operational efficiency.
Worked Example 2 — Operating Profit Method
Scenario: A SaaS company’s CFO has operating income available from internal reporting and wants to confirm EBITDA without reconstructing interest and tax figures.
Available Figures:
Line Item | Amount |
Operating Income (EBIT) | $670,000 |
Depreciation | $80,000 |
Amortization | $30,000 |
EBITDA Calculation:
$670,000 + $80,000 + $30,000 = $780,000
Both methods arrive at $780,000, confirming they are mathematically equivalent when applied to figures from the same income statement. (Note: EBIT of $670,000 = Net Income $500,000 + Interest $50,000 + Taxes $120,000.)
EBITDA vs. EBIT vs. Net Income — Comparison
Metric | Excludes | Includes | Primary Use Case |
Net Income | Nothing | Interest, taxes, D&A | Shareholder earnings; dividend capacity |
EBIT (Operating Income) | Interest, taxes | Depreciation, amortization | Cross-jurisdiction operating efficiency |
EBITDA | Interest, taxes, D&A | All revenue-driven activity | M&A valuation multiples; debt-capacity sizing |
EBITA | Interest, taxes, amortization | Depreciation | Asset-heavy businesses; real asset-cost visibility |
EBIT is closer to GAAP operating profit than EBITDA because it still reflects the wear and cost of physical assets through depreciation. EBITDA’s broader exclusions make it a better proxy for operating cash flow for comparative purposes — but only an approximation; it is not a cash flow statement replacement.
EBITDA Margin — Formula and Industry Benchmarks
EBITDA Margin (%) = (EBITDA ÷ Total Revenue) × 100
The EBITDA margin calculation expresses profitability as a share of revenue, enabling meaningful comparisons across businesses of different sizes, geographies, and capital structures.
Indicative U.S. industry benchmarks:
Industry | Typical EBITDA Margin Range |
Software / SaaS | 20% – 40% |
Healthcare Services | 10% – 20% |
Manufacturing | 10% – 15% |
Retail (general) | 5% – 10% |
Restaurant / Hospitality | 8% – 15% |
Oil & Gas (exploration) | 30% – 50% |
These ranges are indicative and shift with economic cycles, input costs, and regulatory changes. A margin significantly above the industry norm may reflect efficient operations or unusually high non-cash charges that inflate the EBITDA numerator; a margin well below the norm warrants deeper review of cost structure and pricing power.
How Lenders and Buyers Use EBITDA
EV/EBITDA Valuation Multiple
Private equity firms and strategic acquirers price acquisitions using the Enterprise Value (EV) to EBITDA multiple:
EV/EBITDA = Enterprise Value ÷ EBITDA
Enterprise value represents the total capital deployed in the business — market capitalization plus net debt. The S&P 500 median EV/EBITDA has historically ranged from 10× to 14×; sector-specific and private-market multiples vary widely based on growth rate, margin profile, and deal competition.
LTM vs. Full-Year EBITDA
Buyers and lenders almost always calculate EBITDA on a Last Twelve Months (LTM) basis — summing the most recent four calendar or fiscal quarters — rather than relying on the prior fiscal year. LTM EBITDA captures the company’s most current operational run rate and avoids distortion from non-representative historical periods.
LTM formula: Prior Full Fiscal Year EBITDA + Year-to-Date EBITDA (current year) − Year-to-Date EBITDA (prior year same period)
Debt Covenants
Commercial lenders embed Total Debt / EBITDA or Net Debt / EBITDA ratios as maintenance covenants in credit agreements. Typical ranges fall between 3.0× and 6.0× depending on industry and credit environment. A borrower whose leverage ratio breaches the covenant threshold faces a technical default, which can trigger accelerated repayment obligations. Business owners pursuing acquisition financing or refinancing should compute their EBITDA carefully and monitor covenant headroom on a rolling basis.
Risk Factors — When EBITDA Can Mislead
EBITDA is a useful screening metric, but regulators, experienced investors, and credit analysts consistently flag several limitations:
- Ignores capital expenditure (CapEx). A capital-intensive manufacturer spending $500,000 annually replacing worn equipment has real cash demands that EBITDA does not capture. Free cash flow — operating cash flow minus CapEx — is a more complete measure of cash generation for such businesses.
- Ignores working capital movements. A growing business extending credit to customers may show strong EBITDA while simultaneously consuming cash through expanding receivables.
- Ignores debt service. A company with $780,000 EBITDA and $720,000 in annual interest payments is in a fundamentally different financial position from a debt-free peer with the same EBITDA figure.
- Subject to “adjusted EBITDA” manipulation. Management teams sometimes present “Adjusted EBITDA” that adds back charges that recur in practice. The SEC requires public companies to reconcile any adjusted non-GAAP measure to GAAP net income under Regulation G; private-company buyers should interrogate every adjustment during due diligence.
- Not equivalent to operating cash flow. EBITDA does not account for changes in working capital, cash taxes paid, or actual cash interest — all of which appear only on the statement of cash flows.
Common Mistakes to Avoid
- Mixing reporting periods. All five inputs must come from the same fiscal period. Combining a full-year depreciation figure with a single-quarter net income produces a meaningless result that overstates annualized EBITDA.
- Confusing operating income with gross profit. Operating income (EBIT) already deducts SG&A, R&D, and other operating expenses. Gross profit does not. Using gross profit as the starting point for the Operating Profit Method will materially overstate EBITDA.
- Double-counting amortization of debt issuance costs. Under ASC 835, amortization of debt issuance costs flows through interest expense on many income statements. Adding it back a second time in the amortization field inflates EBITDA.
- Omitting lease-related adjustments. Under ASC 842 (U.S. GAAP, effective 2019 for public companies and 2022 for private companies), operating leases are capitalized. Some analysts now separately compute EBITDAR — adding back rent/lease payments — for comparability with pre-ASC 842 benchmarks.
- Presenting pro forma EBITDA adjustments without disclosure. Adding back recurring charges as “one-time” items without clear labeling misleads buyers and lenders. Each adjustment to arrive at adjusted EBITDA should be separately itemized and justified.
related finance & banking calculators
Money Market Calculator: Plan your investments alongside spousal support payments. This tool helps you estimate returns on savings or investments, ensuring you can meet financial obligations while growing your wealth.
Frequently Asked Questions
EBITDA stands for Earnings Before Interest, Taxes, Depreciation, and Amortization. The Net Income Method uses: EBITDA = Net Income + Interest Expense + Income Taxes + Depreciation + Amortization. The Operating Profit Method uses: EBITDA = Operating Income (EBIT) + Depreciation + Amortization. Both formulas produce the same result when all figures come from the same income statement and reporting period.
Locate net income at the bottom of the income statement. Then locate interest expense, income tax expense, depreciation expense, and amortization expense — typically on the face of the income statement or in the financial statement notes. Add all five together: EBITDA = Net Income + Interest + Taxes + Depreciation + Amortization. Optionally, divide the result by total revenue to compute the EBITDA margin percentage.
Standard EBITDA adds back interest expense, income taxes, depreciation, and amortization to net income. Adjusted EBITDA additionally adds back non-recurring or non-cash items such as stock-based compensation, restructuring charges, M&A transaction costs, litigation settlements, and goodwill impairment charges. Each adjustment should be separately disclosed; lenders and buyers scrutinize every add-back during due diligence to determine whether charges are genuinely one-time or recurring in practice.
Net income is the bottom-line profit after all deductions. EBIT (operating income) reverses the effect of interest and taxes, providing a capital-structure-neutral and tax-neutral view of operations. EBITDA goes further by also reversing depreciation and amortization, removing the impact of historical asset acquisition decisions. EBITDA is the broadest of the three measures and is most commonly used for cross-company comparison and acquisition valuation multiples.
EBITDA overstates cash generation when capital expenditure is substantial — for example, a manufacturer spending $400,000 annually on equipment replacement shows that outflow nowhere in its EBITDA. It also ignores working capital growth and actual debt service costs. Free cash flow (operating cash flow minus CapEx) captures these items and is a more complete indicator of cash available to repay debt, pay dividends, or fund growth for capital-intensive businesses.
EBITDA Margin (%) = (EBITDA ÷ Total Revenue) × 100. For example, EBITDA of $780,000 on revenue of $2,000,000 gives a 39.0% margin. Benchmarks vary significantly by industry — SaaS businesses typically target 20%–40%, while grocery retail may operate at 3%–6%. Margin comparisons are most meaningful within the same industry and against peers of similar scale; an above-average margin relative to peers signals either stronger operational efficiency or higher non-cash add-backs that should be investigated.
The standard LTM formula is: LTM EBITDA = Prior Full Fiscal Year EBITDA + Year-to-Date EBITDA (current year period) − Year-to-Date EBITDA (same period, prior year). For example, if the fiscal year ends December 31, and you are computing LTM as of March 31, 2025: add fiscal year 2024 EBITDA, add Q1 2025 EBITDA, and subtract Q1 2024 EBITDA. LTM is preferred over the prior fiscal year in M&A and lending transactions because it reflects the company's most current operating run rate.
Lenders use Total Debt / EBITDA (leverage ratio) to size acquisition financing — typically permitting 3.0× to 6.0× depending on industry and credit market conditions — and embed these ratios as maintenance covenants in credit agreements. Private equity buyers use the EV/EBITDA multiple to price acquisitions, benchmarking the target against comparable public companies and recent M&A transactions. A higher EBITDA simultaneously increases a target's valuation and its debt capacity, making it the single most consequential financial metric in most leveraged transactions.
Reverse the add-backs in order: (1) Start with EBITDA; (2) Subtract depreciation and amortization → EBIT (Operating Income); (3) Subtract interest expense → EBT (Earnings Before Tax); (4) Subtract income tax expense → Net Income. The SEC requires every public company to present this exact reconciliation whenever it discloses a non-GAAP measure such as EBITDA — in earnings releases, investor presentations, or SEC filings — under Regulation G and Regulation S-K Item 10(e).
Official Sources and Methodology References
- U.S. Securities and Exchange Commission (SEC): Non-GAAP Financial Measures guidance under Regulation G and Regulation S-K Item 10(e) — governs how public companies must present and reconcile EBITDA (accessible via SEC.gov).
- Financial Accounting Standards Board (FASB): ASC 360 (Property, Plant, and Equipment — depreciation), ASC 350 (Intangibles: Goodwill and Other — amortization), and ASC 842 (Leases) — the GAAP standards underlying the add-back items.
- American Institute of Certified Public Accountants (AICPA): Guidance on non-GAAP financial measure presentation for private companies.
Important Disclaimer
EBITDA is a non-GAAP financial measure not defined or required by the Financial Accounting Standards Board (FASB) or U.S. Generally Accepted Accounting Principles. The results produced by this calculator are for educational and estimation purposes only and do not constitute investment advice, financial planning advice, business valuation advice, or any form of professional financial or legal guidance. Outputs depend entirely on the accuracy and completeness of the figures you input. Public companies reporting EBITDA must reconcile it to GAAP net income under SEC Regulation G. Before making capital allocation, financing, valuation, or investment decisions based on EBITDA, consult a licensed Certified Public Accountant (CPA), investment banker, or qualified financial advisor.
Last Update: June 2026