
Table of Contents
TogglePayback Period Calculator: Recover Your Investment Faster
The payback period calculator tells you exactly how many years — and months — it will take for an investment’s cumulative cash flows to fully recover the initial cost. Enter your initial investment, annual cash flows, and optional discount rate to instantly compute both simple and discounted payback periods with a year-by-year breakdown.
Financial Calculator
Payback Period Calculator
Accurately calculate Simple & Discounted Payback Period with step-by-step breakdown
Calculation Type
Investment Details
Initial Investment
Total upfront cost of the project
$
Please enter a valid initial investment.Discount Rate
WACC or required rate of return
%
Enter a rate between 0 and 100.Cash Flows
Annual Cash Flow
Net annual cash inflow from the investment
$
Please enter a valid cash flow amount.Number of Years
Duration to project cash flows
Enter a number between 1 and 50.All cash flow entries are required.
Simple Payback — Year-by-Year Breakdown
| Year | Cash Flow | Cumulative Cash Flow | Status |
|---|
Discounted Payback — Year-by-Year Breakdown
| Year | Cash Flow | Discount Factor | Discounted CF | Cumulative Disc. CF | Status |
|---|
For educational purposes only. Not financial advice. Consult a qualified financial advisor before making investment decisions.
Reset Calculator?
This will clear all inputs, results, and saved session data. This action cannot be undone.
Copied!
related finance & business calculators
What Is a Payback Period Calculator?
A payback period calculator is a capital budgeting tool that measures the initial investment recovery time: the point at which the money you put into a project or asset is returned through net cash inflows. It answers the most fundamental question every investor, business owner, or project manager asks before committing capital: “How long before I get my money back?”
Unlike net present value (NPV) or internal rate of return (IRR), the payback method prioritizes liquidity and speed of recovery over total profitability. It is widely used in capital budgeting to screen projects, compare competing investments, and set risk thresholds — particularly when a business needs its capital returned quickly to fund future opportunities.
The calculator supports two calculation modes visible in the tool interface:
- Simple Payback — ignores the time value of money; fastest and most intuitive
- Discounted Payback — applies a discount rate to each cash flow, accounting for the fact that a dollar received three years from now is worth less than a dollar today
- Both — runs both calculations side by side for a complete payback analysis
Payback Period Formula: How It's Calculated
Payback Period Formula for Even Cash Flows
When cash inflows are the same every year (uniform annual cash flow), the payback period formula is:
Payback Period = Initial Investment ÷ Annual Cash Flow
For example, if you invest $100,000 and receive $25,000 per year, the simple payback period is 100,000 ÷ 25,000 = 4.0 years.
Payback Period Formula for Uneven Cash Flows
Most real-world projects generate payback period with uneven cash flows — different amounts each year. In this case, you use the cumulative cash flow method:
- Start with the full initial investment as a negative balance
- Add each year’s cash inflow to the running cumulative total
- Identify the year in which cumulative cash flow crosses zero (the payback year)
- Calculate the fractional portion of that final year using:
Fractional Year = |Remaining Balance at Start of Payback Year| ÷ Cash Flow in Payback Year
Full formula for uneven cash flows:
Payback Period = (Last year before full recovery) + (Unrecovered cost at start of that year ÷ Cash flow in that year)
This gives a precise result in years and decimals, which you then convert to months by multiplying the decimal portion by 12.
Discounted Payback Period Formula
The discounted payback period applies a discount rate (often the cost of capital or a required rate of return) to each year’s cash flow before adding it to the cumulative total:
Discounted Cash Flow (Year n) = Cash Flow ÷ (1 + Discount Rate)ⁿ
You then apply the same cumulative recovery logic as above — but using discounted values. Because discounting reduces the effective value of each inflow, the discounted payback period is always longer than the simple payback period for the same project.
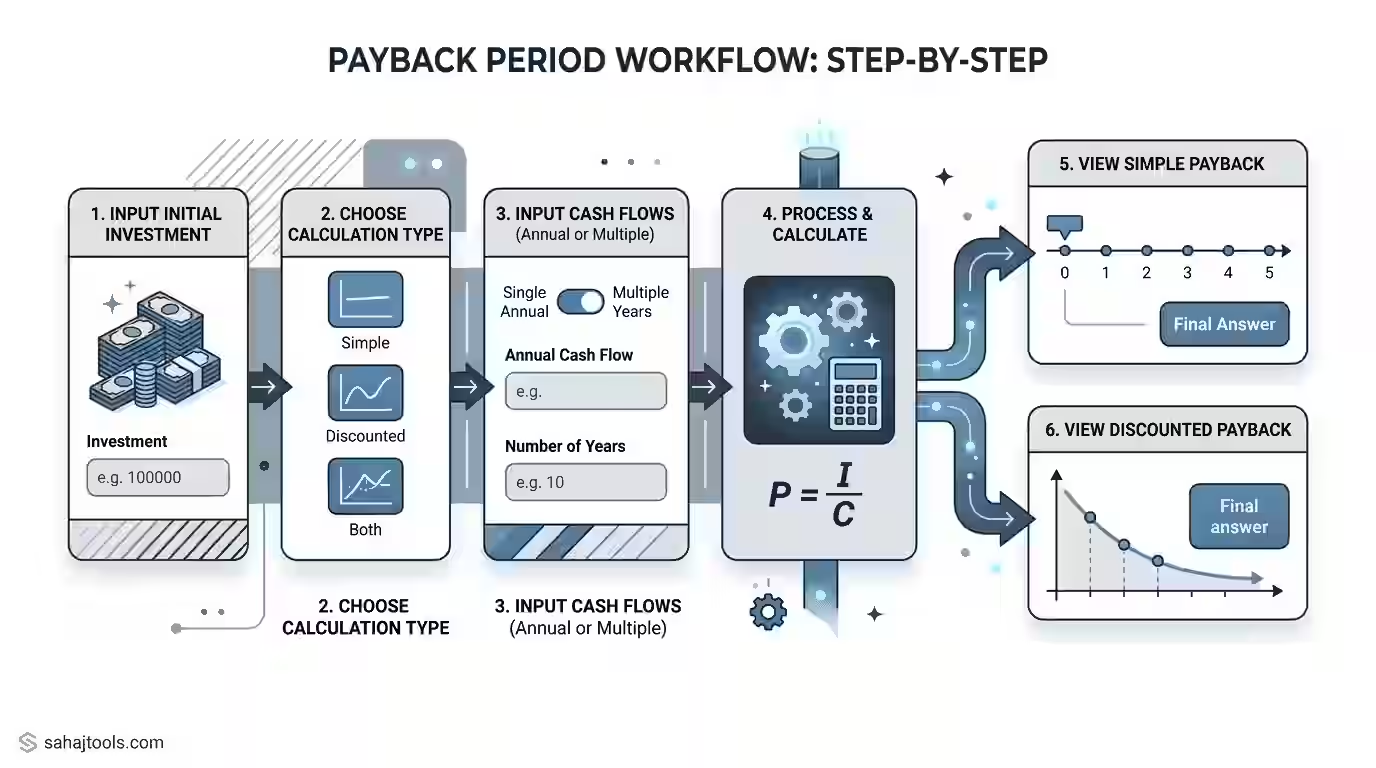
How to Use the Payback Period Calculator: Step-by-Step Guide
The calculator interface shown above is organized into three clear sections. Here is how to use it:
Step 1 — Choose your Calculation Type: At the top, select one of three modes: Simple Payback, Discounted Payback, or Both. Choose Both if you want a complete payback analysis comparing results with and without discounting.
Step 2 — Enter Initial Investment: In the Investment Details section, type the total upfront cost of the project in the Initial Investment field (e.g., 100000 for a $100,000 outlay). This is the capital amount whose recovery time you are measuring.
Step 3 — Configure Cash Flows: Toggle between Single Annual and Multiple Years using the switch in the Cash Flows section:
- Single Annual: Enter one uniform Annual Cash Flow figure. The tool repeats this amount for every year in the projection.
- Multiple Years: Enter each year’s cash flow individually, which is required when the project generates payback period with uneven cash flows (different amounts each year).
Step 4 — Set Number of Years: Enter the Number of Years you want to project cash flows (e.g., 10 years). This defines how far out the calculator checks for recovery.
Step 5 — Click Calculate Payback Period: Press the full-width blue button at the bottom. The calculator instantly returns your payback period result with a cumulative cash flow payback breakdown, showing the year-by-year recovery progress
Worked Example 1: Simple Payback Period with Even Cash Flows
Scenario: A manufacturing company purchases equipment for $80,000. The equipment generates a net annual cash flow of $20,000 every year.
Payback period example calculation:
Year | Annual Cash Flow | Cumulative Cash Flow |
0 | –$80,000 | –$80,000 |
1 | $20,000 | –$60,000 |
2 | $20,000 | –$40,000 |
3 | $20,000 | –$20,000 |
4 | $20,000 | $0 |
Simple Payback Period = $80,000 ÷ $20,000 = 4.0 years (48 months)
To convert payback period in months rather than years: 4.0 × 12 = 48 months exactly.
Interpretation: The company recovers its $80,000 investment at the end of Year 4. Any cash flows generated from Year 5 onward represent profit above the initial investment cost.
Worked Example 2: Discounted Payback Period with Uneven Cash Flows
Scenario: A SaaS startup invests $50,000 to build a new product feature. Cash flows vary year by year, and the required discount rate (cost of capital) is 10%.
Year | Cash Flow | Discount Factor (10%) | Discounted CF | Cumulative Simple CF | Cumulative Discounted CF |
0 | –$50,000 | 1.000 | –$50,000 | –$50,000 | –$50,000 |
1 | $12,000 | 0.909 | $10,909 | –$38,000 | –$39,091 |
2 | $15,000 | 0.826 | $12,397 | –$23,000 | –$26,694 |
3 | $18,000 | 0.751 | $13,524 | –$5,000 | –$13,170 |
4 | $20,000 | 0.683 | $13,660 | $15,000 | $490 |
Simple Payback Period:
Full recovery falls partway through Year 4.
Fractional year = $5,000 ÷ $20,000 = 0.25 → Simple Payback = 3.25 years (3 years, 3 months)
Discounted Payback Period:
Full discounted recovery falls partway through Year 4.
Fractional year = $13,170 ÷ $13,660 = 0.964 → Discounted Payback = 3.96 years (approximately 3 years, 11.5 months)
Key takeaway: The same project has a simple payback of 3.25 years but a discounted payback of nearly 4 years — a difference of 8.5 months. For a capital-constrained business, that gap in payback period vs discounted payback is decision-critical
Simple vs. Discounted Payback: Which Should You Use?
Factor | Simple Payback | Discounted Payback |
Accounts for time value of money | ✗ No | ✓ Yes |
Calculation complexity | Low | Medium |
Best for short-horizon projects | ✓ Yes | Unnecessary overhead |
Best for long-horizon projects | Misleading | ✓ Yes |
Required input | Cash flows only | Cash flows + discount rate |
Typical use case | Quick screening | Rigorous capital budgeting |
Result vs. reality | Optimistic (shorter) | Conservative (longer) |
When to use simple payback: For rapid, first-pass project screening — especially when projects are short (under 3 years) and your cost of capital is low. Simple payback is also the right choice when comparing many projects quickly before committing to deeper analysis.
When to use discounted payback instead of simple payback: Whenever the project spans several years, your discount rate is meaningful (above ~5%), or you are presenting results to investors or a finance committee. A discounted cash flow payback calculator produces a more defensible and conservative estimate because it reflects the real economic cost of waiting.
other finance & banking calculators
- Break-Even Calculator
Determine the point at which your business covers all costs and starts generating profit. Useful for pricing strategies and sales forecasting. - Net Present Value (NPV) Calculator
Assess the present value of future cash flows to evaluate long-term project viability. - Internal Rate of Return (IRR) Calculator
Calculate the expected annual return of an investment, helping you compare opportunities. - Investment Property ROI Calculator
Measure the return on investment for real estate properties, including rental income and appreciation. - Cash-on-Cash Return Calculator
Evaluate the annual return on the actual cash invested in a property, excluding financing.
Payback Period Scenario Comparison: Industry Benchmarks
The appropriate payback threshold varies significantly by industry. The table below shows typical payback period benchmarks by industry ranges used by project teams and capital budgeting committees in the United States:
Industry / Project Type | Typical Acceptable Payback Period |
Retail & consumer goods | 1–3 years |
Manufacturing equipment | 2–5 years |
Commercial real estate | 5–10 years |
Renewable energy (solar, wind) | 6–12 years |
SaaS / software products | 1–2 years |
Marketing ROI campaigns | 3–12 months |
Capital infrastructure | 10–20 years |
Pharmaceutical R&D | 8–15 years |
For capital projects and equipment purchases, a payback period under 3 years is generally considered low-risk. For renewable energy projects, longer payback periods (6–10 years) are standard and often offset by favorable financing, tax credits, and long asset lifespans.
Industry note: These ranges represent common practice, not regulatory requirements. Your organization’s own payback threshold — often called the “cutoff period” — should be set based on your cost of capital, strategic priorities, and risk tolerance.
Factors That Affect Your Payback Period
Several variables can substantially shift the payback period result. Understanding each one helps you run a more meaningful payback period sensitivity analysis before committing to a decision:
- Initial Investment Size: A higher upfront cost directly lengthens the payback period, all else being equal. Reducing the initial outlay through phased investment or shared infrastructure is one of the most effective levers.
- Annual Cash Flow Magnitude: Larger or faster-growing cash inflows shorten recovery time. When projecting a payback period with growth rate — where cash flows increase by a fixed percentage each year — the compounding effect can significantly accelerate recovery in later years.
- Cash Flow Timing and Variability: Uneven or back-loaded cash flows (where most revenue arrives late in the project) produce a longer payback period than front-loaded profiles, even with an identical total. This is one of the most common sources of payback miscalculation in real-world payback period for projects.
- Discount Rate: For the discounted payback period, a higher discount rate reduces the present value of each future cash flow, which extends the recovery timeline. A project that looks acceptable at a 5% discount rate may fail your hurdle at 12%.
- Project Lifespan: The number of years you set as the projection horizon determines whether the calculator can find a payback at all. If cumulative cash flows never turn positive within the project life, the investment does not pay back — a critical output the calculator makes immediately visible.
Common Mistakes to Avoid
- Confusing payback period with profitability. The payback method measures recovery speed, not total return. A project with a 2-year payback that earns nothing afterward is inferior to a project with a 4-year payback that generates returns for 20 years. Always use payback period vs ROI together — payback is a risk filter, not a profitability measure.
- Using simple payback for long-horizon investments. On projects spanning 7–15 years (infrastructure, real estate, renewables), ignoring the time value of money can overstate returns by 20–40%. Use the discounted payback period whenever the project duration is significant.
- Ignoring cash flow variability. Applying a single payback period annual cash flow figure to a project with highly variable income is a common error in early-stage analysis. Use the Multiple Years input mode and model each year individually for accuracy.
- Treating payback period as the only metric. Capital budgeting decisions should combine payback period with NPV, IRR, and ROI to get a complete financial picture. Payback alone ignores what happens after recovery.
- Forgetting to convert years to months when needed. Decision-makers often think in months, not decimal years. Always convert: multiply the decimal portion of your payback period by 12 (e.g., 3.25 years = 3 years and 3 months).
Run a payback period sensitivity analysis by testing three scenarios — optimistic, base, and pessimistic cash flows — before presenting results to stakeholders. A project that pays back in 3 years under base assumptions but 6+ years under pessimistic assumptions carries much higher risk than one where all three scenarios converge near 3 years. The calculator’s Multiple Years input mode makes this scenario testing straightforward and fast.
Frequently Asked Questions
The payback period measures how long it takes for an investment's cumulative net cash inflows to fully recover the initial capital outlay. It is expressed in years (and months) and is primarily used as a risk and liquidity metric in capital budgeting — the shorter the payback period, the faster the investor recoups their money.
For uniform (even) cash flows: Payback Period = Initial Investment ÷ Annual Cash Flow. For uneven cash flows: Payback Period = (Last year before full recovery) + (Unrecovered balance ÷ Cash flow in recovery year). The result is in years; multiply the decimal portion by 12 to convert to months.
Each year's cash flow is divided by (1 + discount rate)^n, where n is the year number. The resulting discounted cash flows are then accumulated year by year until the cumulative total reaches zero. Because discounting reduces the effective value of future inflows, the discounted payback period is always longer than the simple payback period.
Use the cumulative method: track the running total of cash flows year by year until it turns positive. The payback period is the year in which the cumulative total crosses zero, plus the fractional portion of that year (remaining deficit ÷ that year's cash flow). The calculator's Multiple Years toggle enables you to enter each year's figure independently.
Fractional year = Remaining unrecovered balance at the start of the payback year ÷ Total cash flow received in that year. For example, if $5,000 remains to be recovered at the start of Year 4, and Year 4 cash flow is $20,000, the fractional year = 5,000 ÷ 20,000 = 0.25, giving a payback of 3.25 years (3 years and 3 months).
Use discounted payback when your project spans more than 3 years, your cost of capital exceeds roughly 5%, or you need to present results to investors or finance teams who require time-value-of-money rigor. For quick, first-pass screening of short-horizon projects, simple payback is sufficient.
Take the decimal portion of the payback period and multiply by 12. Example: 3.75 years = 3 years + (0.75 × 12) = 3 years and 9 months. This is especially useful when comparing projects against monthly budget cycles or reporting payback period for investments to stakeholders who think in months.
The minimum required inputs are: (1) Initial Investment — total upfront capital cost; (2) Annual Cash Flow — either a single uniform figure or individual amounts per year; (3) Number of Years — the projection horizon. For discounted payback, you additionally need a Discount Rate reflecting your cost of capital or required rate of return.
The payback method ignores cash flows that occur after the recovery point, does not measure total profitability or return on investment, and (in its simple form) ignores the time value of money entirely. It also fails to account for risk beyond timing. For these reasons, payback period should always be used alongside NPV, IRR, and ROI — not as a standalone decision criterion.
Important Disclaimer
The Payback Period Calculator is provided for educational and informational purposes only. Results are estimates based entirely on the inputs you provide and do not constitute investment advice, financial advice, or a guarantee of future performance. Past performance of any investment or project type does not guarantee future results, and actual outcomes will vary based on market conditions, execution quality, and factors outside any model’s scope.
All assumptions — cash flow amounts, growth rates, discount rates, and project lifespan — are user-defined. Small changes in these inputs can materially change the payback period result. Before making significant capital allocation or investment decisions, consult a qualified financial advisor, CPA, or investment professional who can evaluate your specific circumstances.
Last Update: June 2026